
Throughout the last few weeks I have been lamenting the lack of skills in schoolboy players as well as opining my reasons for this shortfall. (Are we failing to prepare out players adequately?). I have also spoken about my belief that team practices should rather be based on individual skills instead of the current focus on game plans and unit skills (The close games are usually lost rather than won), what I have not outlined as yet, is how I came to believe in the philosophy of players first instead of the traditional team first approach.
Before I present my findings I will give some background to this study. In 2010 I was appointed as the u15A coach of a prominent school in the Southern Suburbs, a great learning curve for me and one which would ultimately lead me to study the schoolboy game in more detail the following year. In that first year of my appointment of an A side I coached the side as many coaches do, with an emphasis on structure, no risk Rugby and a strong reliance on defence to win games. Without trying to blow my own horn, this approach bore visible rewards as the side improved their results from 10% the year before to 50% the following year. Although the evidence of improvement was there to be seen, I believed that the no risk approach was not in the best interests of the players’ development.
Thus in 2011 I was appointed the u16A coach, moving up with the group for their final year before moving on to the seniors. Before the year started I decided to study where tries were scored, how games were won and lost and what area of the game the side should be focussing on during practices. This I hoped would give me an advantage over other coaches who I believed solely focussed on structure, shadow and unit skills to improve their sides. The evidence I was hoping to gather would show me exactly how important game plans, structure and moves actually were, and if they were not decisive in determining games, what aspect/s were? Thus each game was filmed and meticulously analysed with very interesting results.
The questions I asked at the beginning of the year were:
How is possession won?
Where on the field is possession won?
How many attacking opportunities were there in a game?
What was the average number of phases during a game?
How effective were we on attack?
How did attacks end?
From what source do tries originate?
How many phases does it take to score a try?
Where on the field do tries originate?
With these questions in mind, each games stats were taken down and slowly but surely a picture began to emerge. I will discuss each question with the stats I recorded and then explain how I believe practices should be structured with these stats in mind.
1. How is possession won?
First off I wanted to know where we won possession in a game. From the evidence I found that the majority of possession was not in fact won at set piece (40%), but rather won during general play (53%).
The scrum and lineout accounted for 20% of possession each compared to turnovers – 26% and kicks received – 27%. The remainder being made up of quick tap penalties – 7%. It must be noted that I considered kick offs to be general play not set pieces – we received 63 kick offs thus bringing the kick receive total down to 19% – however if you still add kicks received and turnovers together, you would still have 48% compared to 44%.
It can be argued that the kick off is a set piece and I would agree, however I believe that receiving a kick off at schoolboy level is a great attacking opportunity as sides very rarely practice the chase which allows a counter attacking opportunity.

2. Where on the field is possession won?
Field position was crucial for me as I wanted to know where the majority of our attacks originated, this I deemed very important in gaining an edge over other coaches in the league.
I divided up the field, rightly or wrongly, by taking the try line to 22m line, 22m line to the 10m line and the 10m to 10m lines. This gave me 5 areas, our 22m, our 10m, halfway, opposition 10m and opposition 22m. I did this as I believed the try line to 10m line was crucial in scoring and conceding points.
The results were very interesting as I found out we were playing far too much in our own half, this could have been as a result of our team philosophy of running the majority of our attacks or that our kicking game was poor, thus we played 42% of the game between our try line and 10m line, while only 33% was in the opposition try line to 10m. The rest of the time, 25%, was played between the two 10m lines.
The origins of tries will confirm how important field position is when scoring tries and ultimately winning or losing games.

3. How many attacking opportunities were there in a game?
One of the most important questions I wanted to ask was how many times we had to attack the opposition; this would give me clarity on how to arrange practices according to this finding.
The final statistics came out with 700 attacks over 19 games, at an average of 37 per game. From this we had an average of 7 scrums, 7 lineouts, 10 kicks fielded, 9 turnovers and 3 quick taps per game. We also lost 57 lineouts and 10 scrums at an average of 3 per game for lineouts and 0.5 for scrums. This left us with 633 attacks with which to score points.
What was interesting was that there were only 14 set pieces as opposed to 19 general play and 3 quick taps. This posed the question why was such a disproportionate amount of time spent on set piece play to counter attack and general play?

4. How effective were we on attack?
This question was asked and although I covered it a little differently to how I would do it now, I still believe there is an interesting story behind it.
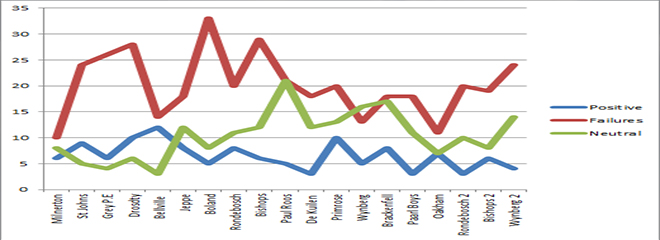
I looked at positive, negative and neutral attacks. A positive attack being either where points were scored or a penalty was won. A negative attack was considered a turnover or penalty conceded and a knock on. A neutral attack was a kick out of hand, a player forced into touch or the referee stopped the attack (ball dead etc.). This is a very basic way at looking at our effectiveness but it no doubt gave me an indication of how effective we were in each game on attack.
The findings read as follows:
Positive: 18% (Average 7 attacks a game)
Negative: 54% (Average 20 attacks a game)
Neutral: 28% (Average 10 attacks per game)
This came as a massive shock, 55% of all attacks over the entire year were failures with only 18% successful. These findings although interesting forced another question in which I will go into more detail later, how do we become more successful on attack?

5. How did attacks end?
The biggest factor for our attacks ending was through a kick with 26% but the biggest shock came from unforced errors which made up 25%! This proved that we did not do enough player skills in the year and no matter how many sessions we did on game plans, it would not make a difference as the players skills were at fault.
Turnovers conceded proved another headache as we conceded 15% of our attacks to the opposition, this meant the players needed to improve in looking after possession. Interestingly we won far more penalties (13%) than we conceded (6%) proving we were not ‘outdone’ by referees as they in fact favoured the attacking side. The disappointing stat was that only 7% of attacks led to tries. The other 9% was made up from being tackled out into touch or dead ball.
This was obviously a key question and the results of this question led me to realise I was spending too much time on game plans and unit skills instead of the players skills and decision making.

6. What was the most common number of phases during a game?
This question was asked as I believed that far too many sides prepare each week for multiple phase attacks, normally using shadow up and down the field when the facts are in stark contrast to how we usually prepare our sides.
The most common phase for my side was 1 phase at a whopping 35% of all attacks! The second, third and fourth most common phases were 2 phases at 21%, 0 (zero) phases at 20% and 3 phases at 10%. Thus the first 2 phases comprised 76% of the game with the remaining 24% being made up of 3+ phases.
You may ask how there were no phases, the answer lies in either turnovers or kicks received where the ball was won and no ruck ensued because of various reasons, either kicking the ball immediately, knocking it on, referee stopping play etc. I interpreted a phase as a set piece (scrum, lineout, kick off) or ruck/maul or tackle. Any attack without those were not deemed a phase. I counted any time we had the ball and could have attacked as a potential attack and was thus counted in the total number of attacks.
These findings showed me immediately that focusing the team’s energy on practising the attack structure endlessly for a number of phases was pointless when the majority of the game was played in 3 phases or less. You may well argue that I didn’t coach my side well enough to play multiple phases, but the try analysis will clearly show that tries are not scored in multiple phases, but rather in less for both my side and the opposition.

7. From what source do tries originate?
The results of this question were undoubtedly one of the most interesting as it proved that the focus on game plans was not as important as previously thought.
The biggest source of tries being scored and conceded came from turnovers, 38% for us and 36% for the opposition. Tries from set piece came second with 23% for us and 25% for the opposition. What was interesting was the fact that quick taps formed a significant portion of the oppositions try source at 25% compared 17% for us. This proved how speeding the game up paid dividends, instead of the slow it down philosophy commonly heard from parents, players and coaches.
Kick receives proved to be a big source of tries for us at 21% while the opposition had only 11%. The kick receive stat was very interesting to me as counter attack is one of the most under practised areas of the game, yet it still provides a large portion of tries (53% both combined) – I just wonder how much more could come from this aspect if coaches spend more time on this aspect?

8. How many phases does it take to score a try?
The amount of phases it took to score a try intrigued me massively as while the most common phases on attack were being tallied up, the phases it took to score directly corresponded with the fact that less phases score tries instead of more. The fact of the matter is that a massive 89% of our tries came from 3 phases or less while the opposition tries came in at an even more impressive 96%.

If you look at the graph below it clearly indicates what occurs to the try scoring rate the more phases are played. Thus the more phases there are in an attack, the less likely you are to score. This is in direct conflict with the way I used to prepare my side.

9. Where on the field do tries originate?
It will come as no surprise that the majority of the tries were scored in the 22m area. We scored 49% of our tries in the oppositions 22m area, while the opposition scored 61% of theirs in our 22m. The area between the opp. 22m and 10m lines was a good source of tries for us at 21% while for the opposition it was only 10%. What was interesting, was that in the area between the two 10m lines the opposition scored 18% of their tries, while we scored 17%, this meant that a good portion of tries could still be scored the further you are from the opposition 22m. It will come as no surprise that the rates dropped to 13% and 11% after the 10m lines towards our own try lines.
What was very intriguing was the fact that in our case only, we scored far more tries when the source originated on the left hand side (47%)of the field as opposed to the right hand side (15%). The area was designated as the touch lines to the 15m line and the rest was considered the centre. The opposition scored an equal amount of tries in all three zones, but we heavily favoured the centre and left hand side. This did not make sense as players usually have a weaker pass to the right, nor did one side receive more ball than the other (Left 40% – Right 35%).
The answer was because of a few reasons, firstly the wing on the left hand side was a very physical, hard running and very agile player who set up a massive amount of momentum for the attack to take full advantage of, secondly the scrumhalf had an exceptional pass to the right and thirdly if we set up the ball early on the left, the defence would have been tackling with their left shoulders and not the usually stronger and more favoured right side.

It must be noted that these results were from just one team at u16 premier school level covering one year. However I am in the process of studying the UCT u20 side and from watching a few different schoolboy sides this year I strongly believe these results to be a fairly accurate description of what goes on in most schoolboy games. I am hoping these results could hopefully begin a serious debate and possibly a re-think about how we coach sides at grassroots level.
As a result of these findings I have changed my philosophy on how I prepare my players as I believe it is something I really believe can give a side a significant advantage over the others who are not as well prepared. The biggest question that must now be answered is how do we become more successful on attack?
Firstly from the evidence I believe it can be clearly stated that the amount of time coaches spend on game plans and structure does not correlate into more tries, in fact I believe it is the cause of many lost scoring opportunities. The fact is that the more time spent trying to perfect a multi-phase game plan leaves less time for players to improve their skills and decision making. The fact is that more tries are scored through counter attack (53% both combined) than set piece (24% both combined) should already be screaming out to you that the proportion of a practice should be far more focussed on putting players into counter attacking opportunities.
Because there is an average of 37 attacking chances per game, I now try to ensure each player is involved in at least 37 various attacking situations a practice to ensure the sessions are offering players the chance to improve markedly. Attacking scenarios should change and be different every week and include aspects such as ruck turnovers, kick receives, decision making during broken play, set piece turnovers as well as finishing set piece line breaks.I believe we focus far too much time on achieving a perfect attack from set pieces using shadow or controlled contact that sets up imaginary breakdowns and allows long passages of play, that we sometimes forget that very rarely do these moves work to perfection or the defence don’t react the way you envisioned it. Thus I believe that by practising various situations you will be giving your side a vital advantage when the attack varies from the ‘script’.
With the facts presented showing most attacks end in 3 or less phases, and tries are scored in the same way, I believe the focus at practices should be on the 1st – 3rd phase with turnovers occurring regularly so sides are adept at defending and counter attacking from quick turnovers as the opposition also lose the ball from the 3rd phase upwards. Thus I believe a high intensity session with constant turnovers and speed on attack and defence is what is required to be able to handle the constant change during a game.
Together with this high intensity approach I believe quick taps should be practised often as the facts presented indicate that they are a great source of tries, and that by slowing the game down you are losing a distinct advantage over the opposition. Too often sides are scared to speed the game up in case they lose the ball, however I believe the risk more than justifies the reward if you have conditioned your players into being more alert than the opposition at the moment of a penalty.
I now also believe in doing far more high intensity decision making work at the breakdown. This is because I consider breakdown work to be an individual skill as well, simply because errors by individuals are often the cause of conceding turnovers, be it because of poor placing, clean out technique or a poor decision making. It is a skill and needs to be honed by the coach in detail to ensure better ball retention. The more possession you can retain the less chance there is for the opposition to win ball, and generally the more attacking opportunities you have, the more it will lead to points.
To make the most of these attacking opportunities as well as improve on the retention of the ball there has to be a bigger emphasis on players’ individual skills at team practises. I do not believe in the notion that there is not enough time or that it is not the coaches responsibility because if you look at the facts above, the 2nd biggest factor ending an attack are unforced errors. If you are the coach of a side and an attack fails because of an unforced error then it is your responsibility, because the side cannot improve nor win the close games without every player attaining a good measure of skilfulness.
Although I know these stats are not perfect and are open to interpretation, I firmly believe that we should be coaching players differently from what we are doing at present. The heavily reliance on structures and moves being honed using shadow for endless phases against no or controlled opposition is not ensuring our players develop into the players that they could be. I firmly believe that players should be put into far more broken/general play and counter attacking opportunities to ensure that they are firstly better prepared to play the game at schoolboy level as well as improve their all round abilities.
Am I on target with my questions or have I missed some? Or would you have done this differently? Let me know what you think in the comments section below as I would love to hear your thoughts on this. I will be going into more detail on how I think practice sessions should be planned in the next blog.
-Ross Williams
Ross is an enthusiastic coach keen on learning, debating and studying all about how we coach Rugby. He is currently the UCT u20 Technical and Skills coach during the Varsity Cup. He also runs his own private coaching business, Ross Rugby where the focus is firmly on skills coaching.
Find & follow RossRugby


Subscribe to receive my latest blogs straight to your inbox!
6 Comments on “A Statistical Analysis Study on School Boy Rugby”
This is a very interesting study. I need to look at it in more detail with my own analysis, not to question the stats, but to understand what that means to me as someone involved in the Coca-Cola Youth Weeks.
One of my biggest complaints during all the Coca-Cola weeks was the lack in basic skills and the concentration of coaches making the kids to play elaborate game plans when they are not even able to maintain possession. That could explain the attacking opportunities that you talk about due to turnovers. Why are they not able to maintain possession? Well there are various reasons why. I did not do a statistical analysis like you did but I think that I will do one for the next competition. From watching the games I found that they lost possession due to running away from support or the support not finding gaps and putting themselves in positions where the ball carrier is able to pass to them or finally the forwards not playing like forwards so when a back has been tackled there is not one to clean up and maintain possession because there is no one around to help. The next is running with the ball under one arm and not looking after the ball. This creates a lot of turnovers and during the SA Schools trials there were at least 4 tries scored immediately from turnovers like that.
I am keen to look further into what you have written and to post a better response to your study.
I can well imagine that at the Coca-Cola Youth Weeks the issue of poor skills in players because of the over reliance on structure at the players schools would be exasperated ten fold from I have seen locally.
I honestly do not think this issue is limited to certain schools, but rather the entire country as a whole where most coaches are following the same model of coaching they believe to be in the best interests of their sides or schools. However I think the winning is everything attitude is ruining our youth structures and I do not think we will be at the top over the next 20yrs unless we drastically overhaul our coaching methods from the bottom up.
Players cannot hold the ball for long periods because of a lack of basic skills, thus the phases are very low and counter attack takes prominence. If we coached our players better we would be seeing a far more attractive and winning brand of Rugby. We cannot rely on our big boys to smash forever, eventually something has to give and I believe it’s either our current coaching structures or our results at the top. We are just bloody lucky we have so much depth that we do not have to ensure our players are as well prepared as those in the UK or Australia. I firmly believe if we implement similar changes we would be on top of the world for a very long time.
I find it interesting from what you say about the SA Schools Trials as this conforms to the views that either our skills are lacking or the counter attack is far more important than we have realised or have worked on improving and defending against. Again from what you say the support runners and options on attack is poor simply because I believe they have not been coached to do it, I think players are encouraged to look for contact to impose themselves on the opposition instead of looking to keep the ball alive. This I believe has filtered down from the top levels of the game and our grassroots coaches are copying what they see and hear simply because our coaching education structures are appalling in South Africa, most notably in the Western Cape.
If you require help during your analysis from either this years festivals or next years event, I would be keen to analyse the games to provide more statistics to my theory as I believe the more games we analyse the more we will learn from them and in term change the way we coach rugby in this country.
I would appreciate any feedback you may have once you have gone through the statistics further. This project was the start of possibly a much bigger picture.
Hi Ross,
I’ve just come across your site and am enjoying the content. This is a really interesting and in-depth post which to me shows that Performance Analysis can and should be utilised throughout all levels of sport and not just at the international/elite levels.
What process did you use to collect the information? You mentioned you planned to do this before the year so did you gather information at every match or did you do it all at the end of the season? DId you use hand notation whilst watching the footage or did you use a computerised analysis software?
I would be interested to hear your answers and would invite you to share some of your work/practices on my own blog site if you would like,
http://www.visualperformanceanalysis.com
We look to gather views from people involved in different sports and levels of participation etc. who have used Performance Analysis so that we can share working practices and information to improve our field, in the same way that your blogs have the potential to improve some coaching practices through discussion and sharing of opinions and experiences.
Josh
Hi Josh,
Thanks for reading the post, much appreciated.
Firstly I started doing this research by hand notation, this was before I purchased Dartfish – I now use Dartfish to continue this study. I collected the information after each game, doubled my work rate after a game but obviously worth it!
I would love to share my experiences and work on your site, I have registered already and will be in contact.
The UK is far advanced in Performance analysis than we are in SA, so this is an aspect I believe we can take to the next level in this country.
Thanks again
Sounds good. Any reasons why you chose Dartfish in particular? I think it is a nice product for technique analysis but I think there are more user friendly bits of kit for tactical analyses that would typically be carried out in Rugby and the methods you mentioned.
Take a look on the VPA site at a blog called The SAS of Performance Analysis, nice post featuring some powerful processes and a very affordable new product.
I look forward to seeing your experiences on our site and hopefully it will be an opportunity to gain information from others in the field who may have questions/answers/feedback to your experiences.
Cheers,
JB
I chose Dartfish, firstly for price – it is much cheaper than anything else on offer in SA, secondly I do both technique analysis as well as statistical analysis thus Dartfish gave me the chance to do both – I could not get 2 different analysis programmes as funding was a problem.
I read the post and checked out NacSport, pricing isn’t too bad either.
Thanks